15.1 Economic Quality of Life of Citizens of Countries

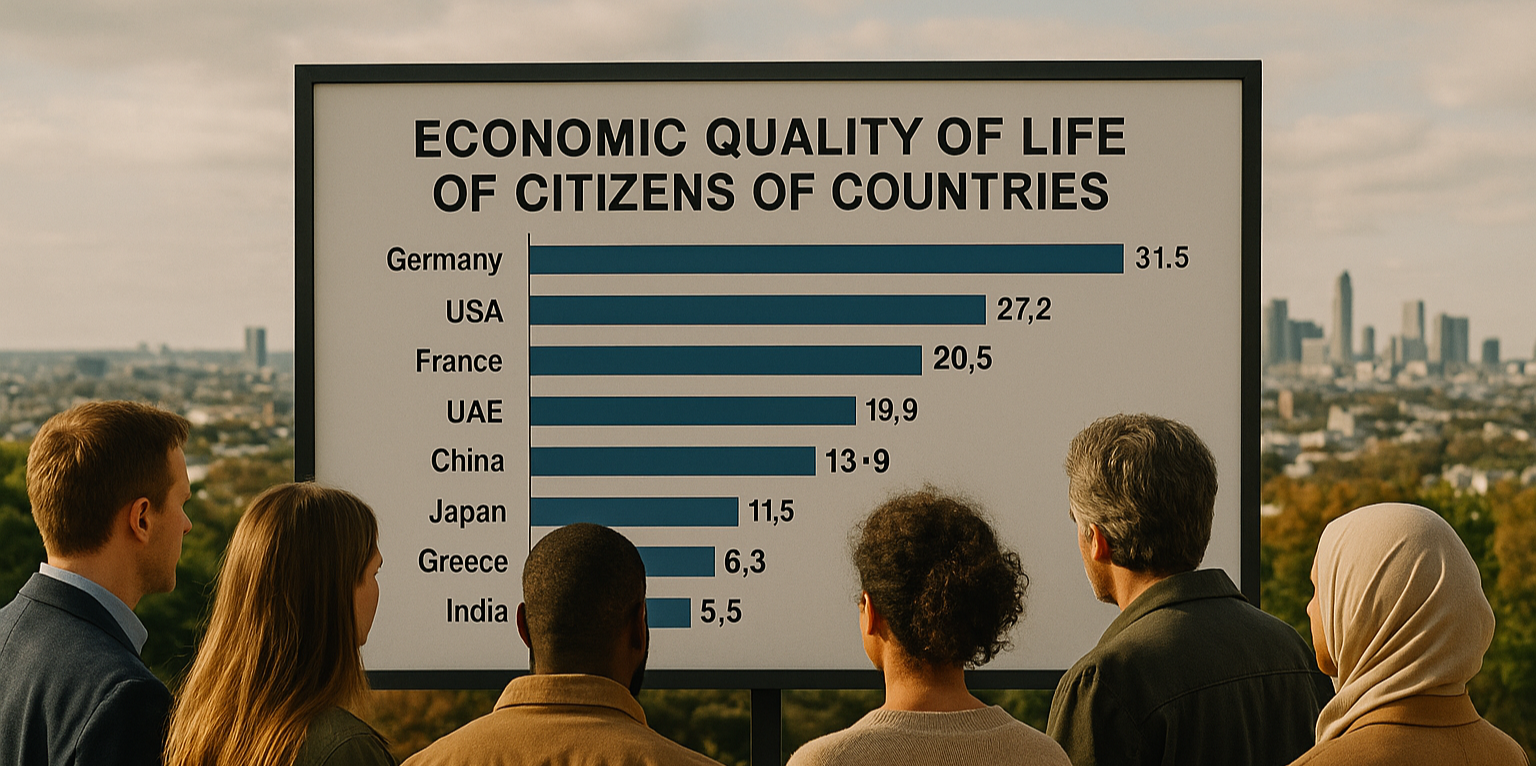
I see various statistics about how well countries are doing based on GDP, debt, and similar indicators. But the economic quality of life for a citizen also depends on population. I felt this growing up: I had to compete for better education and even better groceries. Although salaries were increasing and technology was improving—and I could afford more things than previous generations—my quality of life didn’t feel like it was improving proportionately. My expectations were rising, and my sense of well-being had to keep up with those expectations.

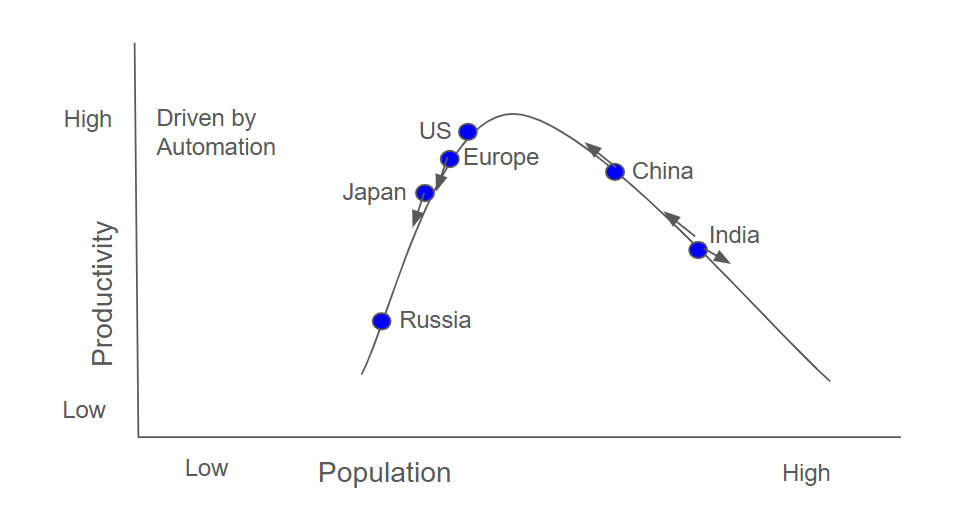
So I came up with a metric that attempts to summarize how an individual feels when all major economic factors are considered. First, let’s look at those factors.


Factors

GDP

GDP increasing is generally good because it means people are producing. But are they producing more than before, or less? Is GDP growth outpacing population growth? If not, the country will eventually fall behind, regardless of how large the GDP appears.

Consumption

I’ve heard that internal consumption is beneficial and that having a large population supports this. Maybe so—but more people also mean more mouths to feed and greater resource usage. Consumption numbers may look strong, but from an individual citizen’s perspective, does this translate into real long-term improvement?

Population

Population growth in Western countries has slowed, while newer economies are seeing higher growth rates. Yet resources almost never grow as fast as populations; there is always a lag. People feel this pinch.

A large young population is often praised because it provides a workforce, but this is a double-edged sword. Production can also increase without a large population, as I explain below. Growth measured by a few narrow indicators often highlights company-level success but neglects how the average person feels.

Debt

Debt is added into the picture based on consumption. It can be good for individuals today, but it may create burdens tomorrow. Still, borrowing is encouraged for individuals as long as they can repay it; the same applies to nations. If a country can grow its future GDP, borrowing today can be justified.

Automation or AI

This is traditionally what we call productivity. If a country can produce more with fewer people, that is extremely powerful because it means more output per person. If productivity keeps increasing, it indicates that the country has strong automation and efficient organizational systems in both government and private sectors. In fact, if GDP grows while population remains stable, automation is likely improving.

Ironically, while everyone touts AI, politicians still celebrate “job creation.” But intelligence—human or artificial—should ideally mean doing less work while producing more. If GDP growth outpaces population growth, some level of automation or efficiency improvement is already happening. Therefore, population must be included in any meaningful comparison.

The Formula

Now by considering all of the above factors, here is a score that can be derived based on the formula,

Score = (GDP*100M) / (Sqrt(National Debt * Population))

Use of sqrt is to reduce the effect of debt, with the optimistic hope that it can be paid off over time, and population growth is sqrt because it’s assumed to be less damaging over a longer time frame.   

The model assumes an even distribution of GDP among the population, but this is not true and the wider this gap, the worse off the person on the street is.

Score of Countries

Based on the above formula, I have listed countries by the scores below.

  • Germany: 5*100T / sqrt(3T*84M) = 31.5
  • USA: 30.6T*100M / sqrt(38.2T*330M) = 27.2**
  • France: 3.36*100T / sqrt(3.92T*68.6M) = 20.5
  • Dubai: 0.119T*100M / sqrt(0.112T*4M) (in AED) = 17.7
  • China: 19.4T*100M / sqrt(18.68T*1,420M) = 11.9
  • Japan: 4T*100M / sqrt(9.83*123.4M) = 11.5
  • Greece (2025):0.257T*100M / sqrt(0.405T*10.2M) = 12.6
  • Greece (Adjusted):0.257T*0.7*100M / sqrt(0.4*10.2M) = 8.8*
  • India: 4.12T*100M / sqrt(3.8T*1,460M) = 5.5

* Greece has recovered and posts a decent score, but the continuous decline has the average person frustrated economically. Also, 30% of Greece’s economy is tourism, so the GDP on the streets is lower and presents an anomaly. 

** Despite many people being better off in the USA, the disparity has widened and the average person cannot keep up with the rising costs.

Conclusion

Ranking countries by GDP or debt alone doesn’t tell the full story. But can the average citizen’s economic life be approximated through the score above? I believe it offers a more balanced picture. Continuous, unchecked growth is not always necessary; growth can also come from efficiency and productivity—not just from adding more people.